
Decarbonisation Whisky Distilleries

Data Validation
A data validation exercise was done for each of the main calculations used in the tool. This was a challenge due to the availability of data. Much of the available data had been used to design equations for the tool. Therefore, care was taken when doing data validation to avoid re-using numbers that had influenced the equations within the tool as this would give a false confirmation.
Methods for data validation included collecting extra data from suppliers, taking data from literature and also the use of a modelling software – Aspen Plus.
The tool cannot be accurate for all distilleries but should give them an idea of the magnitude of the cost and impact of each technology so they can identify which is the most sensible to do further studies on. Therefore, we considered a maximum of 20% variation for technology calculations was considered suitable when doing data validation. The results of the data validation below show that every technology conformed to the margin of error we set out.

Carbon Emissions
To evaluate the tools accuracy and reliability the carbon emissions part of DEFA was analysed against the output of a carbon footprint report done by Eunomia for the Inch Dairnie distillery [1]. The input values given in the report were inputted to DEFA data form to carry out emission calculations. From this most results were within a +/- 20% range which shows a good accuracy for the tool.
Most factors used by Eunomia where from the UK government conversion factors from 2019 and are therefore out of date. The main variations are as follows:
Water consumption shown a -56% compared to Eunomia’s number, this is due to the UK water industry dramatically cutting emissions. Therefore, they are much smaller for the more recent calculations done by DEFA.
Transport shows a large difference of 721%. The values provided by the report produced a high emissions value for the marine transport of casks, but these were not included in the transport values for upstream transport emissions. This is included in Scope 3 emissions for DEFA.
Casks show a massive difference of 4890%. The production of casks emissions was calculated differently to those in DEFA. Within the report the total emission value for cask emissions were broken-down as follows: It is estimated that a cask will last 50 years but only stay at Inch Dairnie for 20 therefore only 40% of emissions were accounted for. Of these emissions they were divided by 20 to give a value of emissions per year. For DEFA, the project decided that as casks will be filled every year the cask emissions value should represent the all the casks purchased by the distillery in that year, not over the lifetime of the casks usage. This is because they do not continually emit emissions throughout their lifetime instead there are released during the manufacturing for them. This results in emissions already released into the atmosphere. Some of the casks could be refills but the offsetting of the manufacturing emissions cannot be said to have occurred for certain by the previous owner. Therefore, the emissions for the manufacture should remain with the distillery. It is for these reasons that the project believe that the emissions reflected by the tool are more up to date and representative of the real emissions of the distillery.


Biogas
Biogas Production:
Biogas production from whisky waste was validated by using Aspen Plus simulation. A non-conventional component was chosen to define barley in Aspen plus and proximate and ultimate analysis was input on as received basis. Using a calculator block, the non-conventional component was broken down as H2, C, S, N2, O2 and H2O. Using a splitter, the whisky process was simplified to produce a waste steam (draff) containing 16% of mineral content [2]
The mixer shows slurry production by missing water and draff which is finally sent to the digestor for converting it into biogas. Digestor is based on stoichiometric based results with a 71% :29% methane to carbon dioxide ratio [3]. The product of digestor is fed to the separator to separate the liquid sludge from the biogas. Hence, the results of the separate overhead show biogas flowrate and its composition. The difference in the results arise due to using an overall reaction calculation in the simulation neglecting any side reactions in an anaerobic digestion process. Nevertheless, the differences show conservative approach rather than overestimation of energy production potential from the waste.


Cost Calculations
Strathendrick AD plant provided us with capital and operating costs associated with their plant. A rough estimate of 6 million per MW for AD plant and 0.765 million per MW for CHP was given for the capital and approximately 5% of the capital is required to operate and maintain the facility. Using this data, the results were compared. A higher difference in AD plant cost is because the calculations are based on purely waste processing AD Plant whereas Strathendrick uses a mixture of waste and crops rich in carbon content which in turn requires smaller residence time and smaller equipment.


Hydrogen
To confirm the data given by suppliers, numbers were taken from feasibility studies and compared to the value calculated by the equation derived from supplier data.
Few feasibility reports contained the data needed to provide validations. The Locogen study gave a 3Tn/hr boiler cost of £200,000 [4]. This was the exact cost given by the tool and therefore suggests a good level of accuracy for this size of boiler.
Other data given in these feasibility studies was used in the creation of the equations for the tool and therefore cannot be used for data validation as it will of course match the calculated results [5].

Electrification
To confirm the equation used for the electric boiler capital cost equation, costings were collected from another supplier [6] and compared with the tool output.
The results confirmed that the calculated values were within 17% of the new supplier’s values. Therefore, it was deemed appropriate to use this equation for the tool.
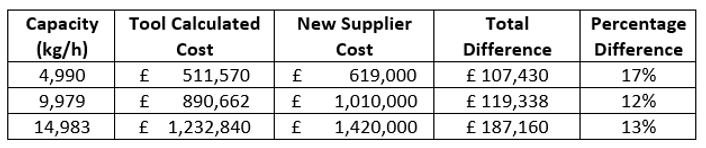
It should be noted that the lower capacity value showed the largest percentage variation and therefore distilleries with smaller boilers should be aware that the costs may be higher than estimated for smaller boilers.
References
[1] Beechener, G., Johnson, A., Hann, S. and Hilton, M. (2020). InchDairnie Distillery Carbon Footprint. [online] Available at: https://inchdairniedistillery.com/wp-content/uploads/2020/12/InchDairnie-Distillery-Carbon-Footprint-Report.pdf [Accessed 17 May 2022].
[2] Distillery by-products as feeds for livestock: a report made to the Malt Distillers’ Association of Scotland, n.d. . SAC, Aberdeen.
[3] Peris Serrano, R., 2010. Biogas Process Simulation using Aspen Plus. Simulation of Biogas Production.
[4] Locogen Ltd (2021). Decarbonising the Distillation Process via Direct Fuel Switching from Fossil Fuels to Hydrogen. [online] Available at: https://assets.publishing.service.gov.uk/government/uploads/system/uploads/attachment_data/file/978982/Locogen_Ltd_Phase_1_Feasibility_Report.pdf [Accessed 17 May 2022].
[5] Protium, Deuterium, Bruichladdich and ITPEnergised (2020). Project HyLaddie BEIS Green Distilleries Competition Phase 1 Report. [online] Available at: https://assets.publishing.service.gov.uk/government/uploads/system/uploads/attachment_data/file/978975/HyLaddie_Phase_1_Feasibility_Report.pdf [Accessed 16 May 2022].
[6] Aboosi, A (2022) Email to Rachel Morse, 28 April.